
The Hidden Cost of an Unoptimized DRA Program and How to Size It
How DRA optimization can help surface economic opportunities across chemical use, power demand, and pipeline throughput.
On a large oil pipeline system, even a relatively small efficiency gap can carry significant economic weight. KartaSoft's economic framework shows that a 1% improvement in combined DRA and power efficiency can represent tens of millions of dollars in annual value, depending on system scale and operating conditions.
The practical challenge is working out whether that gap exists in your operation, where it sits, and what is driving it.
DRA Optimization Is Bigger Than Chemical Spend
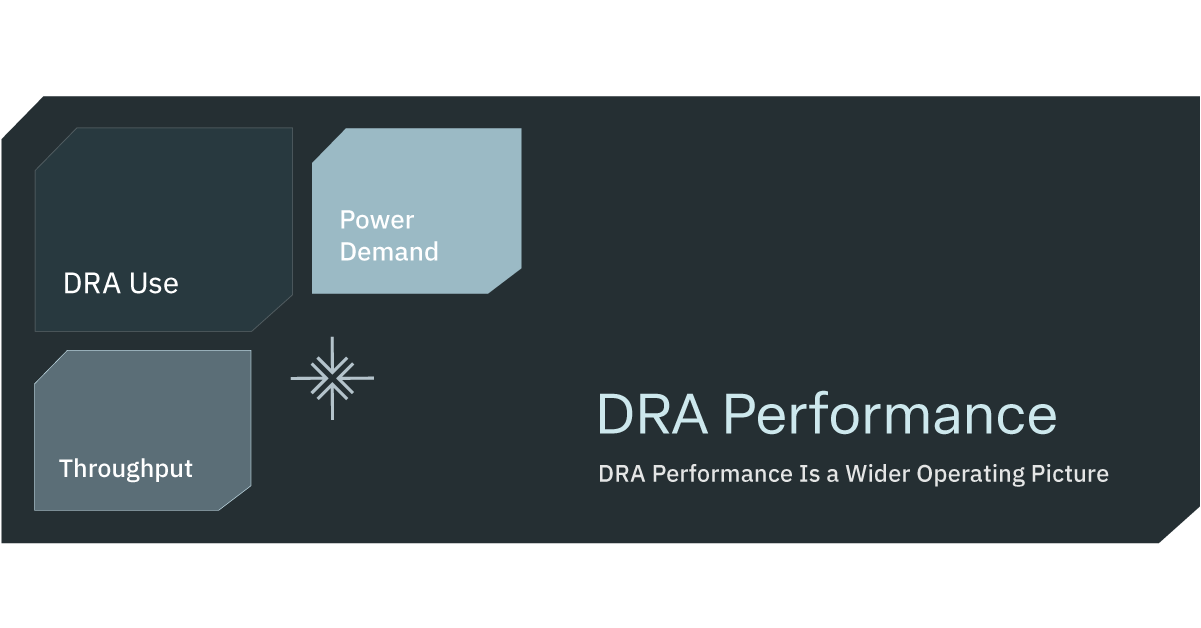
Drag reducing agent optimization is often treated as a question of how much chemical is being used. That is one part of a wider operating picture.
A DRA strategy sits within a connected set of operating conditions. Chemical use, hydraulic performance, power demand, and throughput are closely related, which means a change in one part of the system can affect how the others should be evaluated.
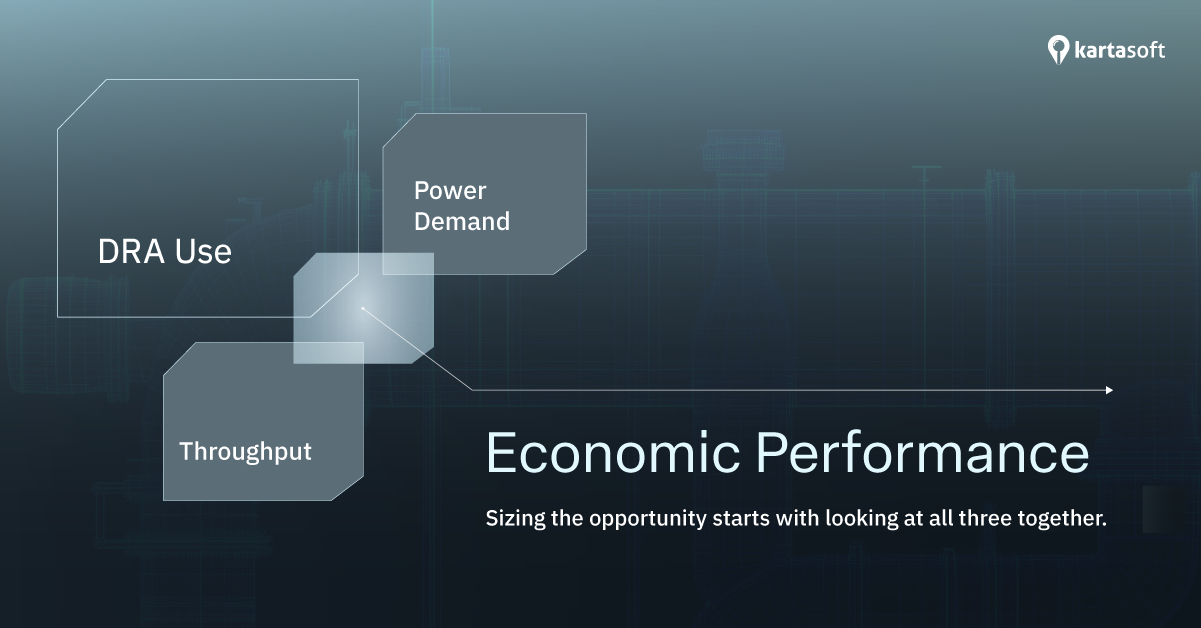
Chemical use, power demand, and throughput therefore need to be considered together. Looking at one in isolation, most often chemical spend, can miss how the wider operating picture is changing. A more complete view of DRA optimization considers all three as connected parts of DRA performance.
Where the DRA Optimization Gap Comes From
A DRA dosing strategy is typically established under a specific set of operating conditions, such as a given flow rate, product, temperature range, or equipment configuration.
Those conditions can change over time. Flow shifts with demand. Product batches vary. Temperature and pressure conditions change. Pumps move in and out of service.
Together, these shifts can change the hydraulic conditions a dosing strategy is operating within. Effective DRA dosing optimization therefore involves periodically asking whether the assumptions behind the current strategy still reflect the conditions on the line today.
The original strategy may have been well calibrated for the conditions in which it was developed. As those conditions evolve, its underlying assumptions may deserve another look.
Why the Gap Can Be Difficult to See
Even where a DRA optimization gap exists, it may not show up clearly in day-to-day monitoring.
Chemical spending can look reasonable on its own. Power consumption can look reasonable on its own. Throughput can look reasonable on its own. Viewed individually, those numbers provide only part of the operating picture.
The relationship between DRA use, hydraulic response, power demand, and throughput provides additional context. That relationship can be difficult to assemble when the underlying information sits across separate reports, systems, or review cycles.
As a result, a gap can develop between the assumptions behind a dosing strategy and the conditions the pipeline is operating under today without necessarily creating an obvious signal in any one metric.
How to Size the Economic Opportunity
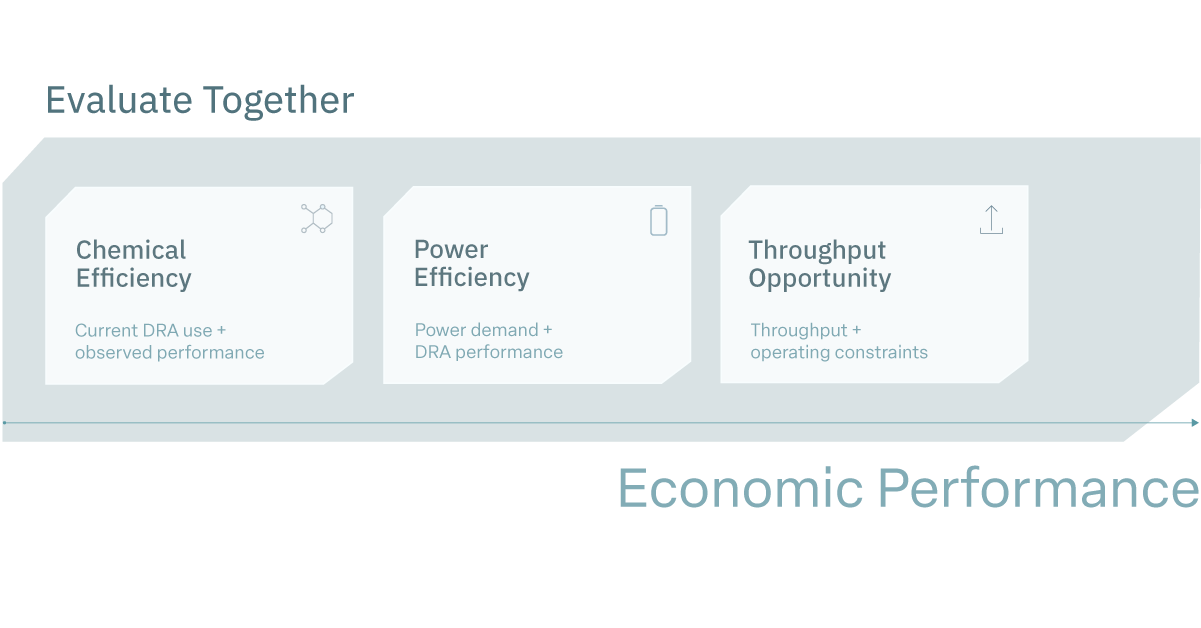
Sizing a potential DRA optimization opportunity means looking at chemical use, power demand, and throughput together, with the objective of understanding how the current DRA strategy is performing under current operating conditions.
-
Chemical efficiency. The starting point is comparing current DRA use with the hydraulic performance observed under current operating conditions. The objective is to understand whether changes in chemical use continue to correspond with meaningful changes in pipeline performance.
-
Power efficiency. Power demand provides another part of the economic picture. Evaluating it alongside DRA use and pipeline performance can help teams understand how the current dosing strategy relates to the energy required to operate the line under current conditions.
-
Throughput opportunity. Throughput adds the third dimension. Here, the evaluation looks at whether the relationship between dosing, hydraulic behavior, and operating constraints suggests that additional operating margin may be worth investigating.
Taken together, these three dimensions provide a broader basis for evaluating the economic performance of a DRA strategy than chemical use alone.
This is where the earlier economic framework becomes practical. KartaSoft's framework considers chemical use, power demand, and throughput together to evaluate how relatively small efficiency changes can translate into meaningful economic value at large pipeline scale.
Sizing the opportunity for a specific operation means applying that same three-part view to actual operating data and evaluating what the evidence supports.
How Dynamic DRA Intelligence Supports the Evaluation
Evaluating DRA performance this way requires bringing several sources of operational data into the same picture, including DRA use, flow, pressure, temperature, batch conditions, power demand, and throughput.
Dynamic DRA Intelligence evaluates existing operational data across these variables to provide engineering teams with additional visibility into DRA performance as operating conditions change.
It operates as a read-only advisory layer alongside existing systems and workflows, without changing control systems or replacing engineering judgments. The engineering team continues to interpret the evidence and make operational decisions.
For teams that review DRA performance through scheduled studies, this creates an additional way to evaluate how the assumptions behind the current strategy are holding up as operating conditions evolve.
Start With One Corridor
Sizing a potential DRA optimization opportunity does not require evaluating an entire network at once.
It can start with one corridor: reviewing existing operational data for that segment, comparing current conditions with the assumptions behind the current DRA strategy, and evaluating whether there is enough evidence to investigate further.
If your team is reviewing DRA performance, start with one corridor. Explore how Dynamic DRA Intelligence uses existing operational data to evaluate DRA use, power demand, and throughput under current operating conditions.