Interpreting Pipeline Risk Scores: What Do the Numbers Mean?
If one pipeline segment has an index score of 70 and another scores 35, what can an engineering team conclude?
The higher score may help establish a priority. Whether it represents twice the risk is a different question.
For gas transmission engineering and integrity teams, interpreting pipeline risk scores starts with understanding what an output measures, how it is expressed and which conclusions its evidence supports. That distinction helps teams use a ranking without asking the number to answer a question it was not designed to address.
Does an Index Score of 70 Mean Twice the Risk of 35?
No. In an illustrative example from the Pipeline and Hazardous Materials Safety Administration (PHMSA), two segments assessed using the same relative assessment/index model score 70 and 35. The higher score indicates higher relative risk. The numbers alone do not establish that the risk is twice as great.
The example appears in the agency’s 2020 report, Pipeline Risk Modeling: Overview of Methods and Tools for Improved Implementation.
The distinction is between order and magnitude. The model places one segment above another, but the numerical gap does not, by itself, quantify the difference in risk.
What Does the Output Measure, and How Is It Expressed?
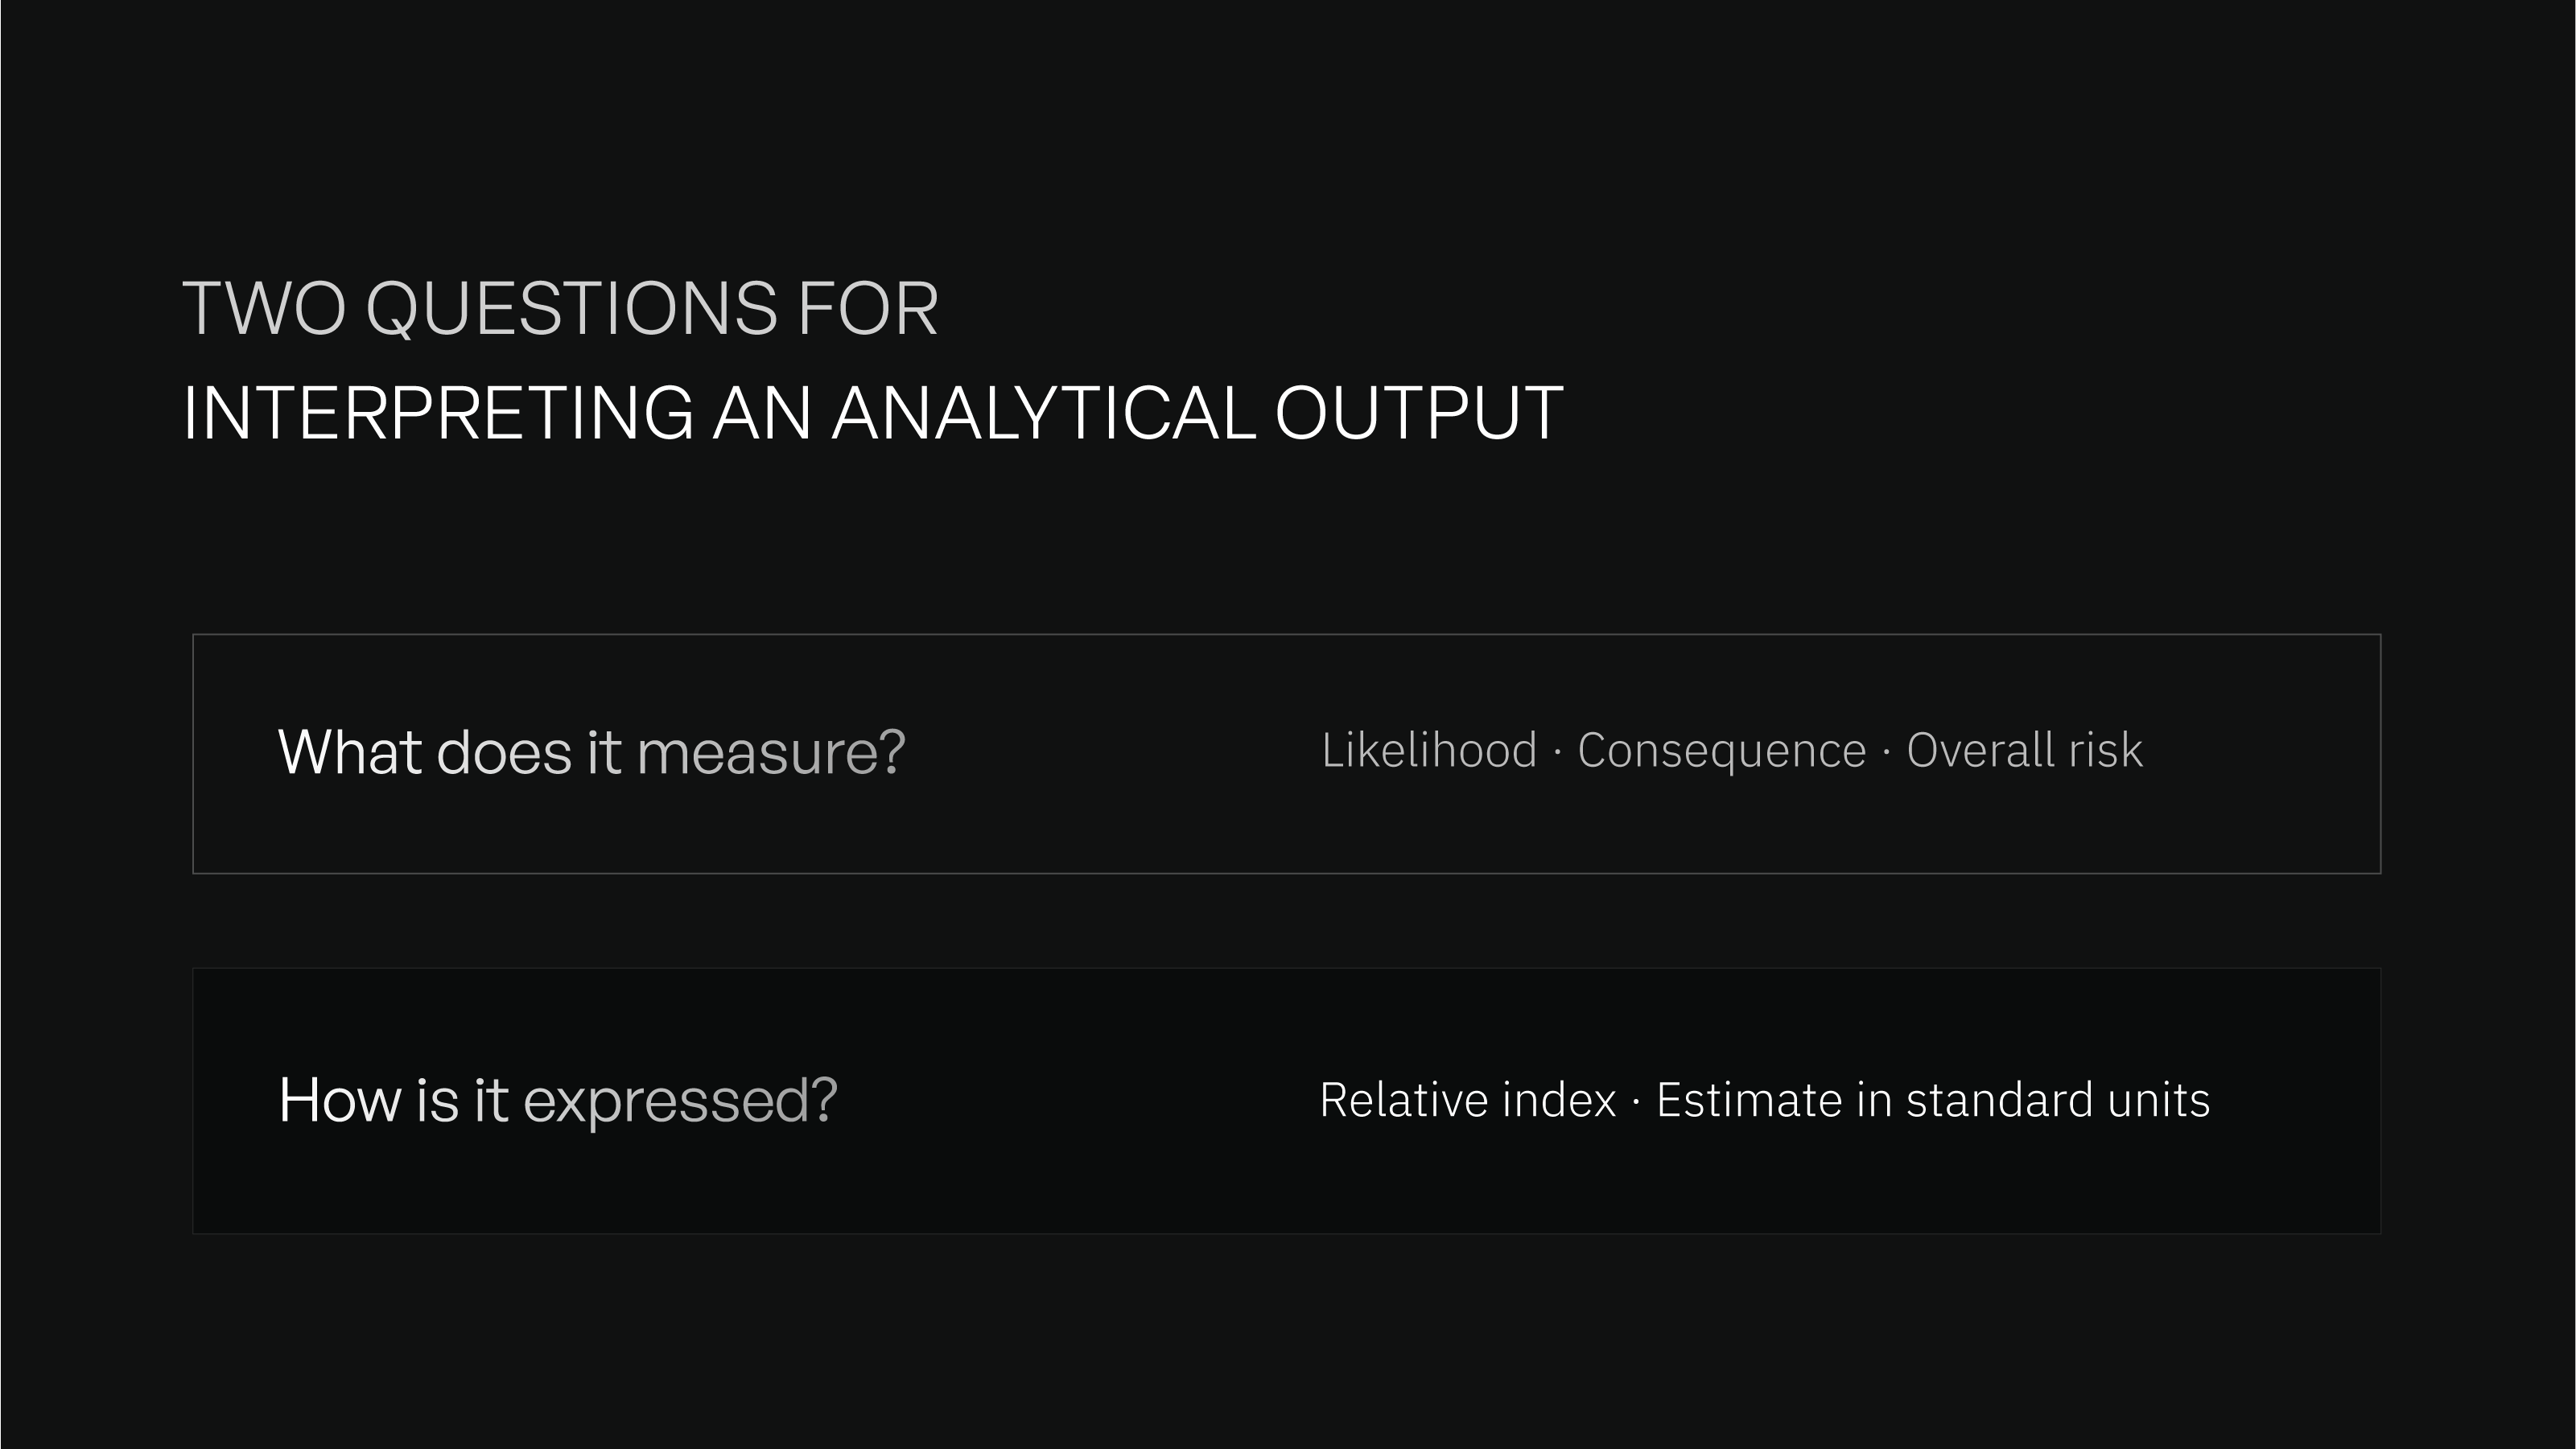
Two separate questions help explain an output: what it measures and the form in which it presents that information.
The subject might be likelihood, consequence or overall risk. The form might be a relative index or an estimate expressed in standard units.
These distinctions can coexist. A likelihood output can be a unitless index; calling it a “likelihood score” does not automatically make it a probability estimate. A consequence score can similarly express a relative position without estimating a particular amount of loss.
The label therefore needs an explanation. It helps to know what the model represents before interpreting either the value or the difference between values.
Is a Likelihood Score a Probability Estimate?
It depends on the output’s definition. A relative likelihood index expresses a comparison within the model. A probability estimate addresses the chance of a specified event over a defined period.
Likelihood can also be expressed as frequency, making the time or exposure basis important. Before interpreting an output, a reviewer needs to understand the event, period and basis of the estimate—not simply whether the result is numerical.
What Does a Consequence Estimate Describe?
A consequence estimate describes potential impacts if a defined event occurs. In pipeline risk modeling generally, those impacts may be expressed through measures such as injuries, fatalities or financial loss.
This describes modeling approaches generally, not KartaSoft’s consequence methodology. For the separate question of which context may matter, see Likelihood vs. Consequence in Excavation Damage Prevention.
Which Conclusions Can the Number Support?
The intended question matters as much as the output.
For the illustrative scores of 70 and 35, asking which segment ranks higher is different from asking how much greater its risk is. A numerical answer to the first question does not automatically answer the second.
PHMSA’s report recognizes relative assessment/index models as applicable to establishing risk priorities for baseline integrity assessments. It also explains why judging differences in risk may require additional analysis. Comparing preventive or mitigative measures, or conducting benefit-cost analysis, generally needs output in consistent units.
The practical task is to match the conclusion to what the analysis supports. A reviewer can use a ranking for prioritization while recognizing that a decision requiring the magnitude of risk differences needs a different evidentiary basis.
What Remains Uncertain When the Output Looks Precise?
A precise-looking number can still depend on uncertain inputs and assumptions. Its presentation does not explain how well those inputs represent the segment or conditions under consideration.
Consider the same 70/35 comparison. Knowing the order leaves further questions about the information behind it. Are important inputs measured, estimated or assigned scores? Where information is incomplete, what assumptions were used? Could plausible changes affect the ranking?
These questions examine the basis of the result. They do not assume that every uncertain input makes an output unusable.
Uncertainty becomes more informative when its implications are clear: which conclusions remain supported, which depend on assumptions and what additional information could change the interpretation.
PHMSA describes additional processing and interpretation of qualitative and index-model results as part of the operator’s wider risk assessment and evaluation process, outside the model itself. The output contributes information; its use still requires interpretation in context.
How Do These Questions Apply to KartaSoft?
These questions apply to KartaSoft analytical outputs . In Class Location Intelligence, the event being estimated is escalation to a higher Class Location, not pipeline failure, and the planning horizon is configurable.
The approach follows a retrospective evaluation against known Class Location outcomes, including whether past escalations would have been identified, potential lead time and false positives. These evaluation questions concern that specific application.
Understanding an output means knowing both what it contributes and where its interpretation needs further evidence. That is a useful starting point for discussing any analytical result.
Discuss the evidence your team needs to interpret a risk output with KartaSoft.
Source: Pipeline and Hazardous Materials Safety Administration, Pipeline Risk Modeling: Overview of Methods and Tools for Improved Implementation, February 2020, pages 9, 18, 20–21, 24–25, 28 and 31–32.